- Home
- /
- Brunei-landing-2020
- /
- Brunei-Economy
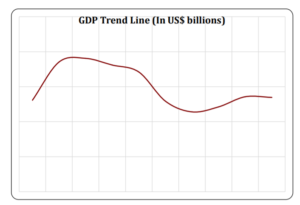
GDP– As per the World Bank, in the year 2019 the GDP of Brunei stood at US$ 13.46 billion. Over the last 10 years, the growth of GDP has been very erratic in Brunei, as result of this the GDP grew by a mere 3% from 2009 to 2019. In the year 2012, the country recorded the highest GDP at US$ 19 billion. Which fell drastically to reach US$ 11.4 billion in the 2016. The contribution of Brunei in the GDP of the ASEAN doesn’t even account for 1%.
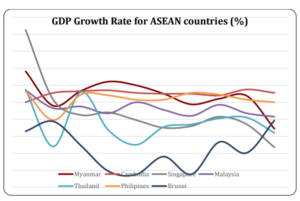
GDP Growth (%)- The GDP grew leaps and bounds in the first part of the decade. But between 2013-2017 the economy witnessed negative economic growth, following which it showed signs of recovery. In the year 2018-2019, the GDP of the economy grew by about 3.87%.The following chart shows the comparison between Brunei and the other countries in the ASEAN. On comparison with the OECD and the G7, Brunei has consistently outperformed them.
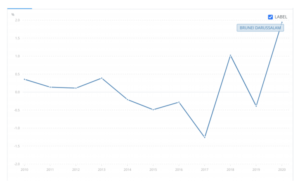
Inflation Rate- The following chart depicts the inflation rate of the economy over the past 10 years. In 2019, the inflation rate reached 0.39%.
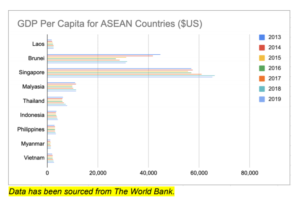
GDP Per Capita – Brunei has the second highest GDP per capita, amongst the ASEAN countries after Singapore. This is a result of the small population of the country coupled by the abundance of the petroleum and oils available in the land. In 2018, Brunei had a GDP per capita of 30,644 USD. The chart below indicates the GDP per capita of all the ASEAN countries between 2013-2018.
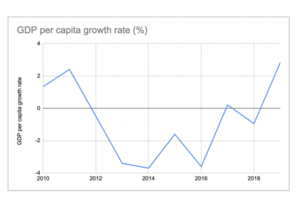
GDP Per Capita Growth Rate– Brunei has always had a very high GDP per capita. But in the last 5 years the growth in the GDP per capita hasn’t really shown growth trends. Over the last 5 years, the GDP per capita has decreased by 31%. Despite the decrease in the GDP per capita over the years, Brunei still has the second highest GDP per capita in the ASEAN.
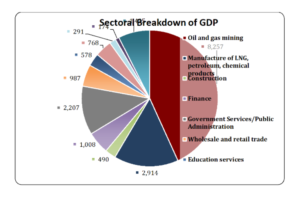
Sectoral contribution to GDP – The following chart depicts the sectoral breakdown of the GDP of Brunei in 2019, as per the data provided by the Department of Economics Planning and Statistics. The biggest contributor to the GDP without doubt is Oil and Gas Mining contributing about 43%, followed by manufacturing of LNG, petroleum and other chemical products contributing 15% to the GDP of Brunei.
Services
Services have always been second to industry in terms of contribution to the GDP of Brunei in the last 10 years. Though an upward trend has been observed in the services sector. A growth of 17.5% has been observed in the last 10 years in the contribution of services to the GDP of Brunei. In 2019, the contribution of the services was 38% after observing an increase of .848 points from the previous financial year.
Industry
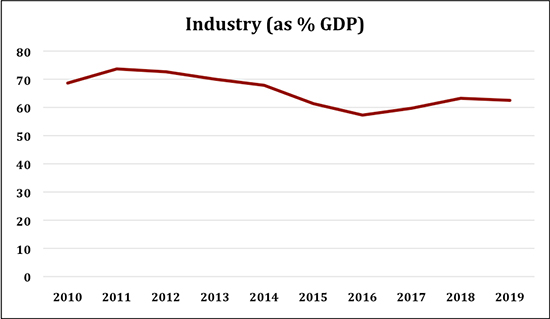
For years industry has been the highest contributor in the GDP of Brunei. The primary reason for this is the abundance of the resources found in Brunei. Oil and petroleum account for the majority of the contribution to the Industrial sector. Although the sector has seen a negative growth in the last 10 years of about 8.9% in its contribution to the GDP. In 2019 the contribution of the industrial sector stood at about 62.5% in the GDP of Brunei, after a decrease of 0.7 points from the previous year.
Agriculture
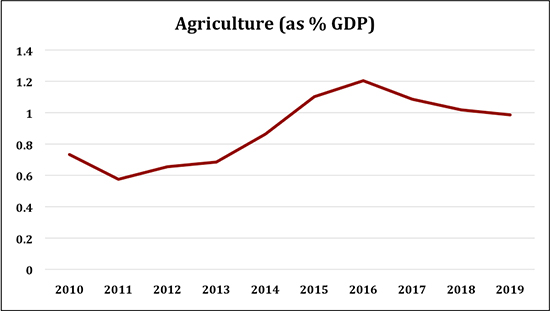
Brunei predominantly an industrial and services based economy. The contribution of agriculture is almost negligible. The highest contribution of agriculture to the GDP of the Brunei was observed in the year 2016 where it contributed a mere 1.2% to the GDP. In 2019, the contribution of the agricultural sector to the GDP was about 0.98%, which is an improvement in the last 10 years from 0.73% in 2010. As a result of this despite being a small economy, Brunei is considered to be a developed economy.
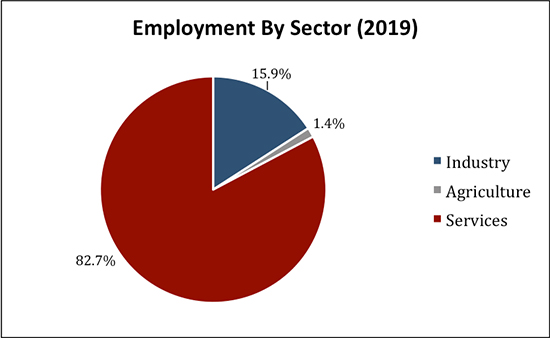
Employment by Sector- As per the World Bank data (based on ILO estimates), the following chart depicts the employment by sector in Brunei in 2019.
From the above chart it is very clear that the services sector accounts for majority of the employment in the economy, at about 83%, whereas Industry accounts for roughly 16% and the remaining 1% is taken up by the agricultural sector. An important takeaway is the additional efforts taken to diversify and not be reliant on the industry for the contribution it makes to the GDP. Thus, we see that additional manpower being focused to the services sector.
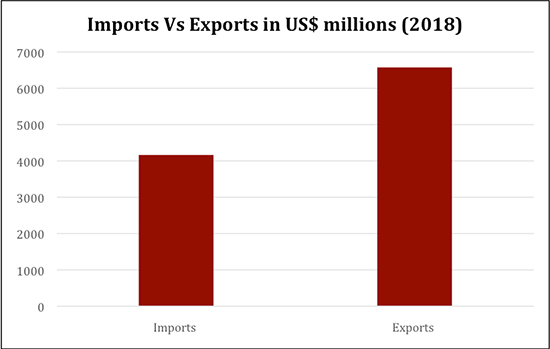
Imports and Exports- Despite the small size of the economy of Brunei the country is a net exporter. According to the World Trade Organisation, in 2018 the imports of Brunei amounted to US$ 4164 million, whereas the exports amounted to US$ 6574 million. This gives Brunei a positive balance of payments amounting to US$ 2410 million. A few important figures regarding imports/exports in relation to GDP are as follows: –
Brunei, Exports of goods and services as percentage of GDP is 51.93 %.
Brunei, Imports of goods and services as percentage of GDP is 41.96 %.
Primary Trade Partners – Trade partners of Brunei are categorised as importing partners and exporting partners.
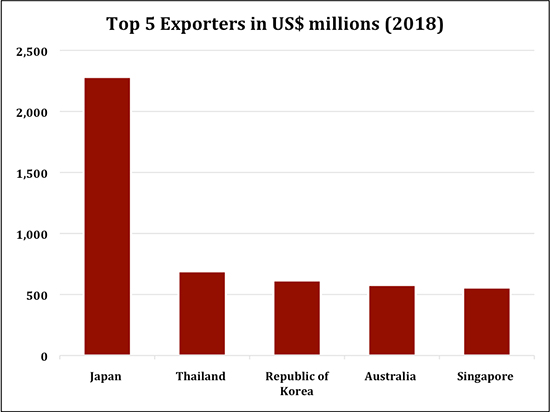
The top 5 export markets for Brunei in 2018 were as follows:
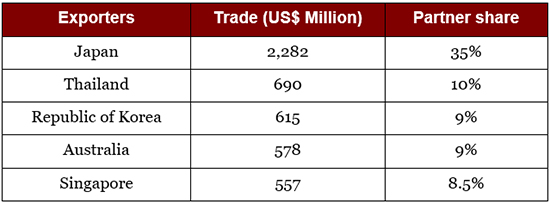
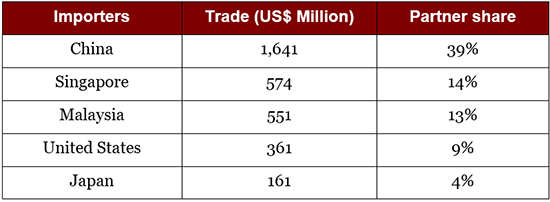
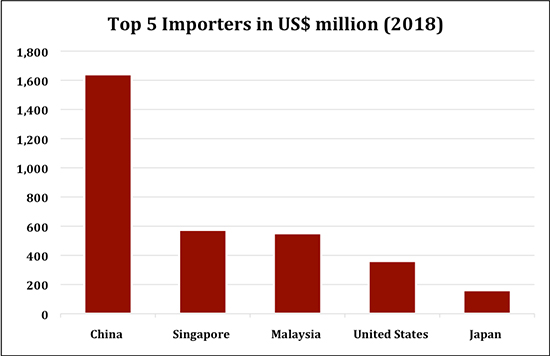
The top 5 import markets for Brunei in 2018 were as follows:
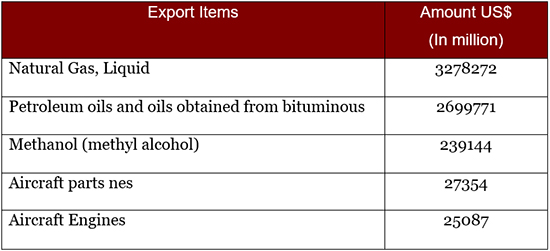
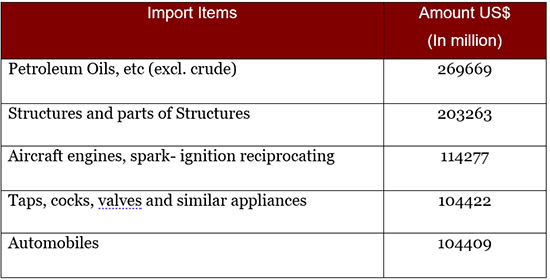
Product contribution to exports and imports – The charts below depict the top 5 export and import items of Brunei.
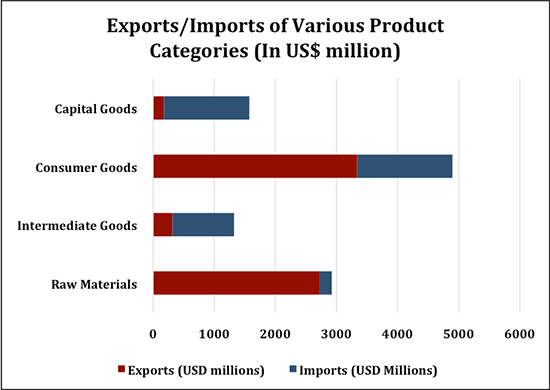
Exports/Imports of Various Product Categories- The following chart depicts the quantities exported and imported in the various product categories namely- Capital Goods, Consumer Goods, Intermediate Goods and Raw Materials in the year 2018.
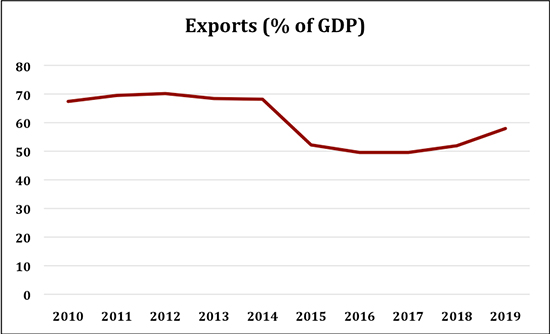
Exports to GDP Ratio – The following chart depicts the exports to GDP ratio of Brunei between 2010-2018. As of 2018 the Exports to GDP lies at roughly 58%.
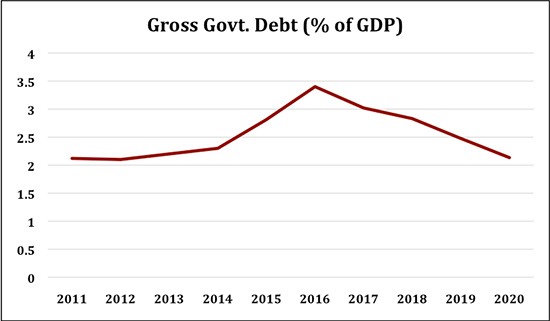
Debt to GDP Ratio – The chart below depicts the Gross government debt of Brunei as a percentage of GDP. In the first half of the decade till 2016, we see an upward till the ratio reached its peak at 3.4%, and saw a gradual decline to reach 2.1% in 2020.
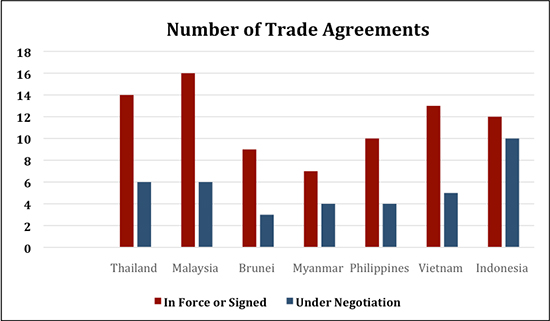
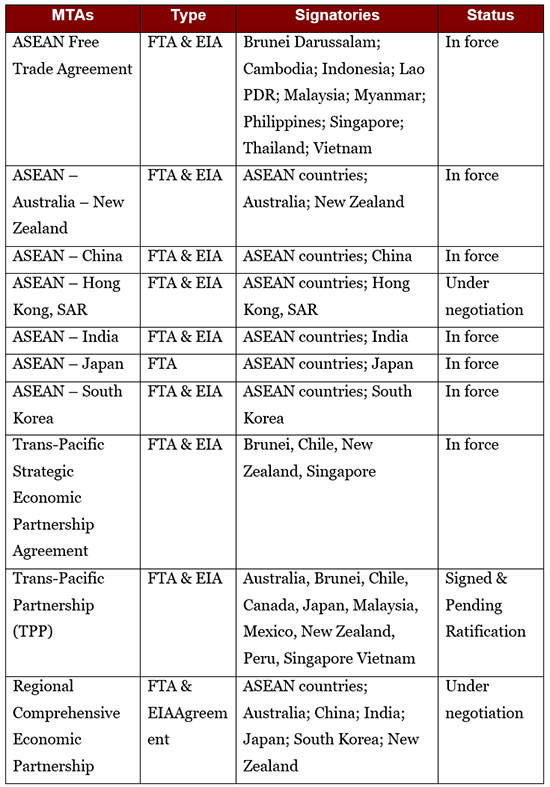
Trade Agreements –Brunei is part of the ASEAN Free Trade Agreement (AFTA) and several other plurilateral/bilateral Free Trade Agreements (FTAs). As a result of these agreements businesses in Myanmar can carry out tariff-free trade with multiple nations. A comparative view of 7 major ASEAN economies, as seen in the graph below, reveals that Brunei has a lot of catching up to do, relative to its other ASEAN peers. The chart depicts that Brunei is the country with the least number of trade agreements (both enforced and under-negotiation) only after Vietnam.
Brunei’s Trade Agreements can be classified into the following two groups:
– Multilateral Trade Agreements (MTAs)
– Bilateral Agreements (BTAs)
– Bloc – Bloc Agreements
FTA – Free Trade Agreements
EIA – Economic Integration Agreement
PSA – Partial Scope Agreement
To learn more about Brunei’s trade agreements, follow the link below:

