- Home
- /
- Cambodia-landing-2020
- /
- Cambodia-Foreign Direct Investment
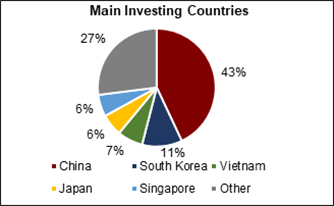
FDI by sector – According to the 2020 World Investment Report by UNCTAD, Cambodia recorded its highest ever FDI in 2019, at USD 3.7 billion (higher than 16% compared to USD 3.2 billion in 2018), mainly due to robust investments in manufacturing and services. The total stock of FDI stood at USD 34 billion in 2019. Out of this the majority of the FDI was in the financial sector (64%) and the rest was in the non-financial sector. As can be seen from the chart below, Chinese FDI was the largest as it has been in the past (43%), followed by South Korea in second place (11%) and Vietnam coming in at third place (7%). The president of the Cambodian Chamber of Commerce also believes that the country will be able to generate additional FDI as it tries to negotiate a free trade agreement with China.
Special Economic Zones – To facilitate foreign investment, Cambodia has created special economic zones (SEZs), which provide ready access to land, infrastructure and other services to help in the setup and operation of businesses. Currently there are 13 SEZs and what is notable is that these SEZs have attracted many MNCs to Cambodia. In recent years the Phnom Penh SEZ has attracted large companies like Coca Cola (which invested US$ 100 million alone), Tiffany & Co., American Licorice.
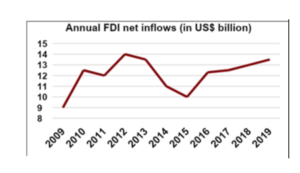
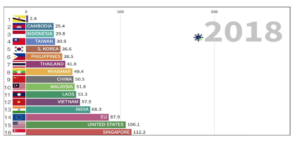
FDI growth over time – FDI net inflows into Cambodia have grown significantly over time. As shown in the chart below, net inflows of FDI have grown from US$ 9 billion in 2009 to US$ 13.6 billion in 2018, and apart from 2015, foreign direct investment has been stable and high every year.
 Economy
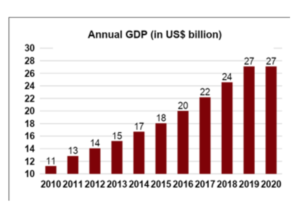
GDP – Cambodia has shown significant improvement in its GDP over the years. As can be seen in the graph below, since 2010 it has more than doubled its GDP and as of 2019 its GDP was US$ 27 billion. However, the projected GDP for 2020 is the same as the last year as the economy slows down due to the Covid-19 pandemic.
 GDP Per Capita – US$ 1,510
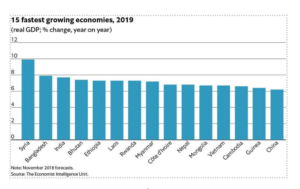
GDP Growth (%) – Cambodia’s GDP has consistently grown by 7% in the last ten years. Its highest growth recorded in the last decade was in 2018, which was 7.5%. As can be seen from the chart below the country is not only one of the fastest growing economies in ASEAN but it is also one of the fastest growing economies in the world which makes it a great place to invest in.
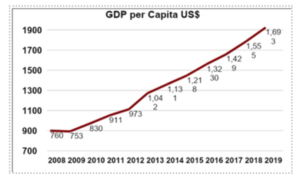
GDP Per Capita Growth (%) – Cambodia’s GDP per capita has grown almost consistently at 5% in the last 10 years with a slight increase every year. In 2018, which was the most recent year of analysis, Cambodia saw its highest growth in per capita GDP at 5.9%. We can also see in the figure below that the country has more than doubled its GDP per capita in the last decade from US$ 830 in 2010 to almost US$ 1700 by the end of 2019.
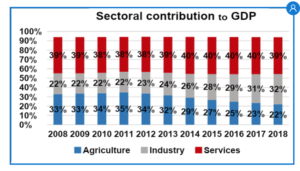
Sectoral contribution to GDP – Contribution to GDP can be broadly segmented into three sectors, namely, Agriculture, Industry, and Services.
As Cambodia continues to see economic growth, its contribution to GDP from the agricultural sector sees a decline and the contribution to GDP from the industrial sector continues to rise. In the figure we can see that the service sector has the biggest contribution towards the GDP at 39%. However, this share has not changed much over the years.
The agricultural sector has seen a decline in its share from 33% in 2008 to 22% in 2018 and this number continues to decline. At the same time as Cambodia becomes bigger, the Industrial sector is taking over and has increased its contribution towards the GDP from 22% in 2008 to 32% in 2018.
A transition from the agricultural sector to the industrial and service sectors show a sign of economic growth and this is a good sign for investor to look for opportunities in Cambodia.
Primary Trade Partners – Trade partners of Cambodia can be categorised as importing partners and exporting partners.
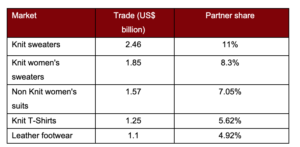
The top 5 export markets for Cambodia in 2019 were as follows:
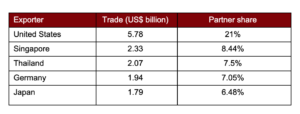
The top 5 exporting countries to Cambodia in 2019 were as follows:
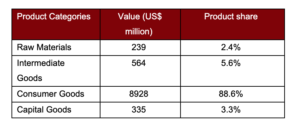
Sectoral contribution to Exports –
The table below illustrates the four categories of goods and their respective product shares.
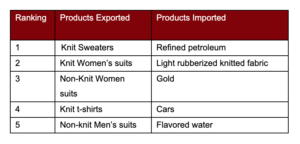
The top five products exported and imported by Cambodia are as follows:
 Exports to GDP Ratio – 61.3%
To learn about Cambodia’s international trade in further detail, click the links below:
https://wits.worldbank.org/countrysnapshot/en/KHM
https://oec.world/en/profile/country/khm?yearSelector1=exportGrowthYear24
Debt to GDP Ratio – Cambodia has one of the lowest Debt to GDP ratios amongst its peers and the same can be seen in the figure below –
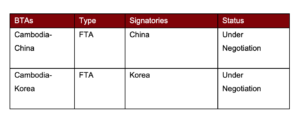
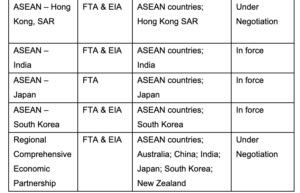
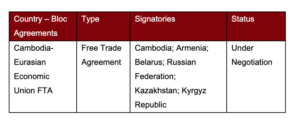
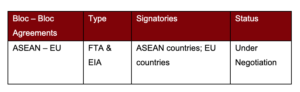
Trade Agreements –
The Cambodian government has consistently tried to improve their trade ties over the years with several countries and currently there are 17 Trade Agreements that are either in force or under negotiation.
Cambodia’s Trade Agreements can be classified into the following four groups:
- Bilateral Trade Agreements (BTAs)
- Plurilateral Trade Agreements (PTAs)
- Country – Bloc Agreements
- Bloc – Bloc Agreements
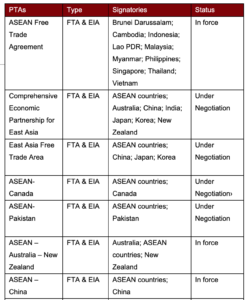
FTA – Free Trade Agreements
EIA – Economic Integration Agreement
PSA – Partial Scope Agreement
To learn more about Cambodia’s trade agreements, follow the link below: