- Home
- /
- Malaysia-landing-2020
- /
- Malaysia-Economy
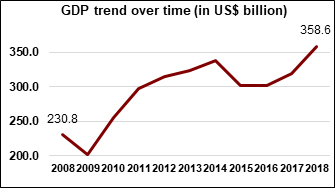
GDP – With a GDP of US$ 358.6 billion, Malaysia has positioned itself as the 4th largest economy in ASEAN, falling narrowly behind its southern neighbour, Singapore. As shown in the figure below, the Malaysian economy has exhibited sturdy growth of 55% since 2008, despite bouts of political instability in the country. This proves that Malaysia can remain resilient when faced with adversity, and thus, one cannot help but be positive about its future economic prospects.
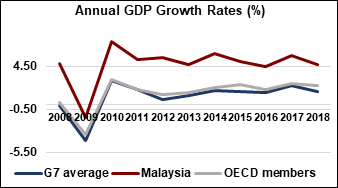
GDP Growth (%) – In 2018 Malaysia recorded an annual GDP growth rate of 4.7%, marking yet another year of healthy economic activity. As can be seen in the figure below, the Malaysian economy has maintained relatively stable year-on-year growth since 2011, but even more noteworthy is the fact that Malaysia has consistently outperformed the OECD and the G7. As the country steps out of a period of political turmoil, it will be important to see if this performance can be kept up.
GDP Growth (%) – In 2018 Malaysia recorded an annual GDP growth rate of 4.7%, marking yet another year of healthy economic activity. As can be seen in the figure below, the Malaysian economy has maintained relatively stable year-on-year growth since 2011, but even more noteworthy is the fact that Malaysia has consistently outperformed the OECD and the G7. As the country steps out of a period of political turmoil, it will be important to see if this performance can be kept up.
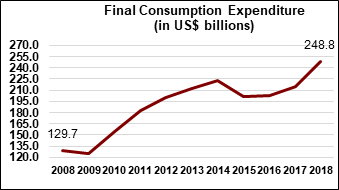
GDP per capita growth (%) – Growth in the Malaysian GDP per capita remained modest during 2018, recording an increase of 3.3% from the year before. However, it is important to note that the average income in Malaysia has grown at a consistent, though mild, pace for many a year, and this might have contributed to the staggering growth in final consumption expenditure that the country has witnessed. As seen in the figure below, consumption expenditure in the nation has nearly doubled since 2008. This could serve as a calling card to foreign investors looking to capitalise on the 31-million-strong consumer base in Malaysia.
Sectoral contribution to GDP – Contribution to GDP can be broadly segmented into three sectors, namely, Agriculture, Industry, and Services.
Services
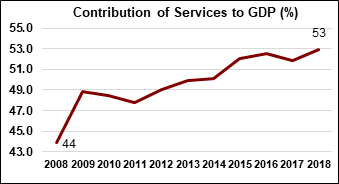
The services sector is the largest contributor to the Malaysian GDP, constituting 53% of the country’s economy in 2018. As seen in the figure below, the services share of GDP has consistently increased since 2008, dethroning the industrial sector, that dominated the economy in the early years of the 21st century. As the importance of services continues to increase in Malaysia, this sector may become a key point of interest for foreign investors looking to enter the market.
Industry
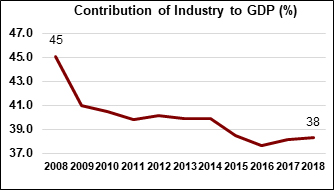
In 2018 the industrial sector made up over 38% of the Malaysian economy, down from over 45% a decade prior. While industry has always been a substantial part of Malaysia’s GDP, it has come to play second fiddle to the services sector. Since 2016, however, the industrial contribution to GDP has pursued an upswing, and if this trend continues, foreign investors may turn a keen eye towards the sector.
Agriculture
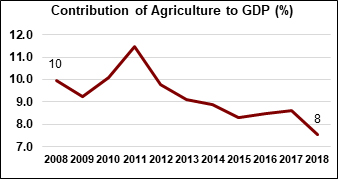
The agricultural sector contributed almost 8% of the Malaysian GDP in 2018. As indicated in the figure below, agriculture has typically constituted a small portion of Malaysia’s economy but even this small share has gradually shrunk with time. With services gaining importance in the country, agriculture is likely to remain in 3rd place, behind the industrial sector.
Primary Trade Partners – Trade partners of Malaysia are categorised as importing partners and exporting partners.
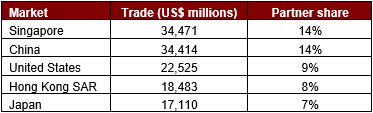
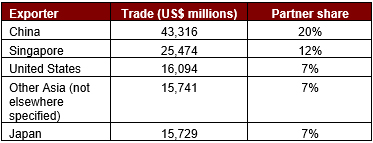
The top 5 export markets for Malaysia in 2018 were as follows:
The top 5 exporting countries to Malaysia in 2018 were as follows:
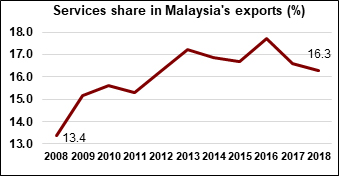
Product contribution to exports and imports – Services constituted a little over 16% of Malaysia’s exports in 2018, thus, conforming to the historical trend of Malaysian exports being largely goods-focused. It is also important to note that the contribution of services to exports has been declining since 2016, as showcased in the figure below. This trend is particularly interesting given the growing importance of the services sector to the Malaysian economy. With other emerging markets in the region increasing their exports of services, Malaysia will have to be careful not to fall behind.
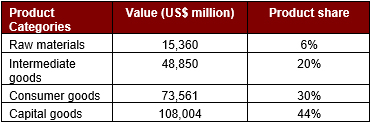
Goods continue to form the majority of Malaysian exports, chalking up a share of 83.7% in the year 2018. The table below illustrates the four categories of goods and their respective product shares.
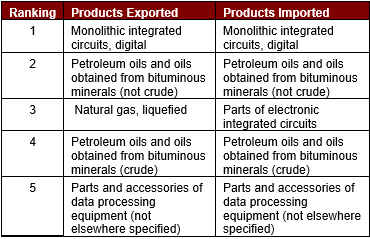
The top 5 products exported and imported by Malaysia are as follows:
Exports to GDP ratio – 68.8%
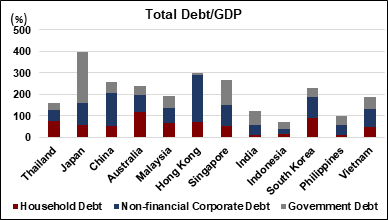
Debt to GDP ratio – In terms of Debt/GDP, Malaysia stands somewhere between advanced economies and developing economies. As showcased in the figure below, Malaysia’s debt to GDP ratio is considerably lower than the levels prevailing in developed nations like Singapore and Japan, but as an emerging market, its performance is poorer than its regional peers’. As competition heats up between the ASEAN developing nations, their respective Debt/GDP levels may become an important factor in attracting foreign investment.
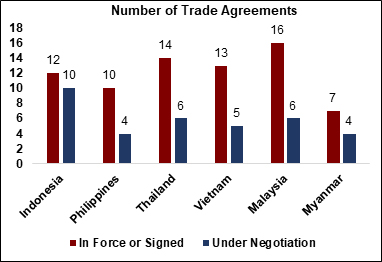
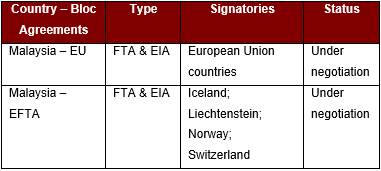
Trade Agreements – Malaysia has a track record of welcoming trade with open arms, and the number of trade agreements it is currently engaged in stands as a testament of this. As displayed in the figure below, Malaysia has more treaties in force than any other emerging market in South East Asia, and it has six more agreements under negotiation. Trade is a vital factor in determining economic prosperity, and Malaysia’s recognition of this will stand it in good stead for the future.
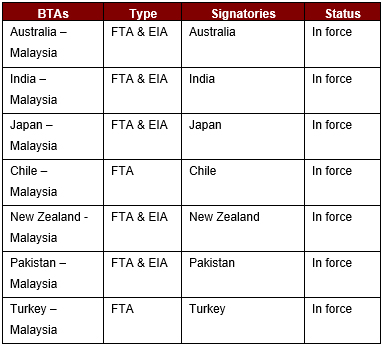
Malaysia’s Trade Agreements can be classified into the following four groups:
– Bilateral Trade Agreements (BTAs)
– Multilateral Trade Agreements (MTAs)
– Country – Bloc Agreements
– Bloc – Bloc Agreements
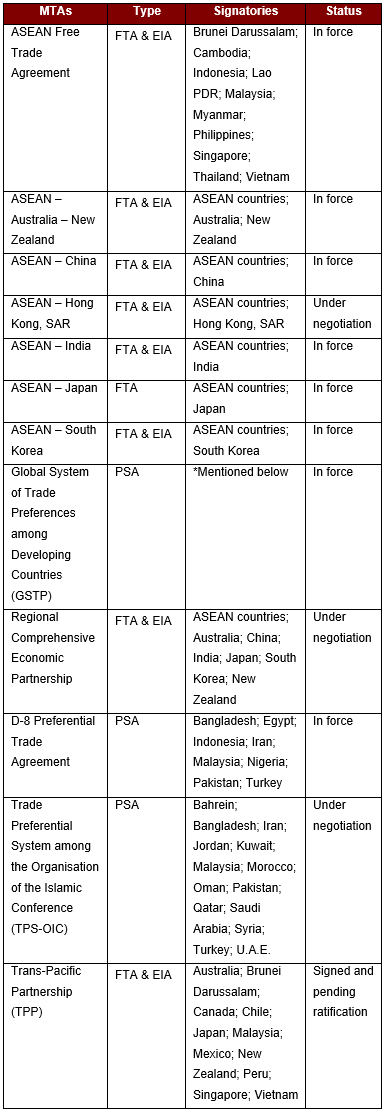
*GSTP member countries – Algeria; Argentina; Bangladesh; Benin; Bolivia, Plurinational State of Bolivia; Brazil; Cameroon; Chile; Colombia; Cuba; Ecuador; Egypt; Ghana; Guinea; Guyana; India; Indonesia; Iran; Iraq; Korea, Democratic People’s Republic of; Korea, Republic of; Libya; Malaysia; Mexico; Morocco; Mozambique; Myanmar; Nicaragua; Nigeria; Pakistan; Peru; Philippines; Singapore; Sri Lanka; Sudan; Tanzania; Thailand; Trinidad and Tobago; Tunisia; Venezuela, Bolivarian Republic of; Vietnam; Zimbabwe
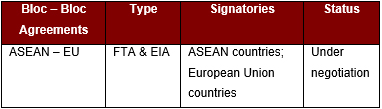
FTA – Free Trade Agreements
EIA – Economic Integration Agreement
PSA – Partial Scope Agreement