- Home
- /
- Thailand-landing-2020
- /
- Thailand – Economy
GDP– Thailand constitutes 16% of ASEAN’s total GDP and boasts the title of ASEAN’s second largest economy. Having grown by 73% over the ten-year period starting 2008, Thailand’s GDP stood at US$ 538.7 bn in the year 2021. The chart below displays the remarkable journey of growth that Thailand’s economy has followed. The fact that this growth was achieved despite political turbulence is a testament to the fortitude of the Thai economic machine.

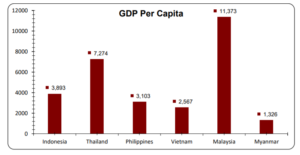
GDP Per Capita –Thailand recorded a GDP per capita of 7,806.74 USD in 2019, the second highest among the six major ASEAN emerging markets. As the chart below indicates, Thailand was second only to Malaysia but the gap between the two could narrow in the future given the Thai Government’s increased focus on distribution of prosperity and developing from the ground up
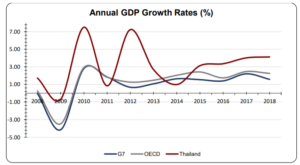
GDP Growth (%) – The GDP of Thailand grew by 2.4% in 2019, considerably above the average growth among OECD countries and G7 members for the same year. Furthermore, the annual GDP growth rate of Thailand has witnessed a consistent uptick in the last five years, more than quadrupling from the mere 1% annual growth that the Thai economy experienced in 2014. As the data below indicates, Thailand’s Y-o-Y growth rate has followed a rocky path, far exceeding its counterparts on some occasions, while falling behind them on others. However, the last few years have seen the Thai economy outperform its developed counterparts consistently, and this may be a sign of the growth that is to come.
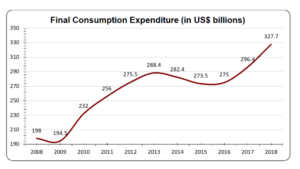
GDP Per Capita growth (%) – Thailand’s GDP Per Capita also grew at an inconsistent rate during the ten-year period from 2008 to 2018. Even though the average growth rate for the last five years has remained moderate at 2.7%, final consumption expenditure in Thailand has continued to grow sharply, as depicted in the chart below. If this trend continues Thailand could become a gold mine of opportunity for foreign investors in the near future.
Sectoral contribution to GDP–Contribution to GDP can be broadly segmented into three sectors, namely, Agriculture, Industry, and Services.
Services
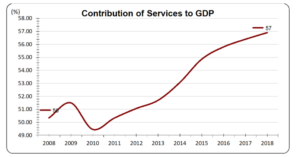
The services sector has always been the primary engine in the Thai economic machine and the contribution of this engine only continues to increase. As can be seen in the chart below, the services share of GDP grew from 50% in 2008 to 54.50% in 2021, constituting a larger part of GDP than agriculture and industry combined. As the services sector continues to grow, it may become a key point of interest for foreign investors looking to establish a footprint in Thailand.
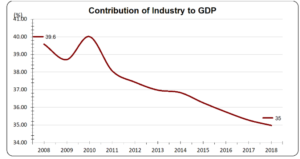
Industry
The industrial sector has also witnessed a reduction in its contribution to Thailand’s GDP. As of 2021, industry constituted 35.70% of the Thai economy, down from 39.6% ten years prior. This decrease in the GDP share of industry could be the result of an increased vigour in the services sector of Thailand.
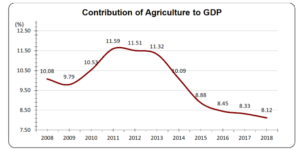
Agriculture
Agriculture has historically been a small contributor to the Thai economy but data reveals that the agricultural sector has seen its share of GDP grow even smaller in the last few years. As reflected in the chart below, the agricultural share of GDP reached its ten-year peak in 2011, and has since consistently declined, standing at 8.60% in 2021
Primary Trade Partners –Trade partners of Thailand are categorised as importing partners and exporting partners.
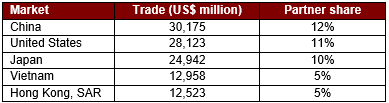
The top 5 export markets for Thailand in 2018 were as follows:
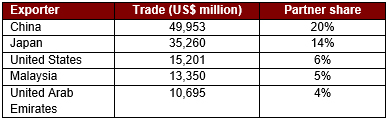
The top 5 exporting countries to Thailand in 2018 were as follows:
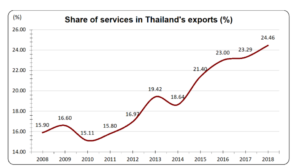
Product contribution to exports and imports – Thailand’s exports can be broadly segregated into two categories, namely, goods and services. As depicted in the chart below, services have typically constituted a relatively small portion of total Thai exports, but the services share of exports has consistently increased over the years, growing from 15.9% in 2008 to 24.5% in 2018. Given that services are becoming increasingly important to the Thai economy, specialisation in the sector could increase as well, thus, leading to a continued increase in exports by the sector.
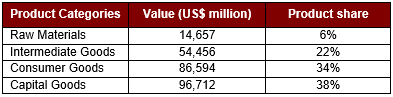
Goods continue to form the majority of Thailand’s exports, occupying a 75% share in the year 2018. Therefore, the composition of Thailand’s trade in goods must be factored into comprehensive investment decisions. The table below illustrates the four categories of goods and their respective product shares.
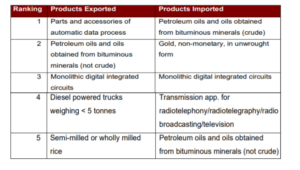
The top 5 products exported and imported by Thailand are as follows:
Exports to GDP Ratio – 66.8%
To learn more about Thailand’s exports and imports, follow the link below:
https://wits.worldbank.org/countrysnapshot/en/THA
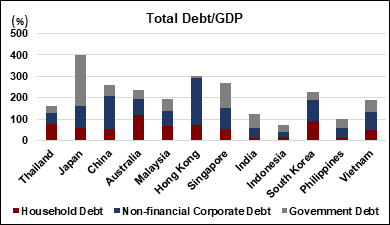
Debt to GDP Ratio – A comparative analysis of Thailand, the United States and other major Asian economies reveals that Thailand has one of the lowest levels of Debt/GDP amongst its peers. As indicated in the graph below, Thailand also has commendably low levels of Government Debt and Non-financial Corporate Debt, making it an attractive option for foreign investors.
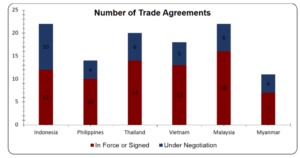
Trade Agreements –Featuring an open economy with liberal economic policies, Thailand is a participant in several bilateral Free Trade Agreements (FTAs), as well as the ASEAN Free Trade Agreement (AFTA). This allows businesses in Thailand to engage in virtually tariff-free trade with 17 different nations, including such major global economies as Australia, China, Japan, New Zealand, South Korea, and India in addition to the other ASEAN members. Thailand is currently involved in 20 international trade agreements, the majority of which are in force. A comparative view of 6 major ASEAN economies, as seen in the graph below, reveals the tremendous strides Thailand has made in foreign trade.
Thailand’s Trade Agreements can be classified into the following four groups:
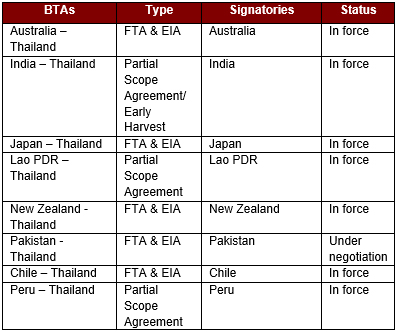
– Bilateral Trade Agreements (BTAs)
– Multilateral Trade Agreements (MTAs)
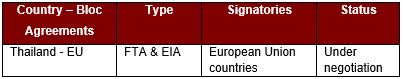
– Country – Bloc Agreements
– Bloc – Bloc Agreements
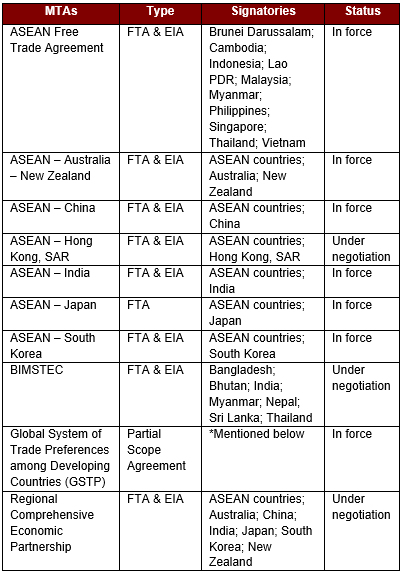
*GSTP member countries – Algeria; Argentina; Bangladesh; Benin; Bolivia, Plurinational State of Bolivia; Brazil; Cameroon; Chile; Colombia; Cuba; Ecuador; Egypt; Ghana; Guinea; Guyana; India; Indonesia; Iran; Iraq; Korea, Democratic People’s Republic of; Korea, Republic of; Libya; Malaysia; Mexico; Morocco; Mozambique; Myanmar; Nicaragua; Nigeria; Pakistan; Peru; Philippines; Singapore; Sri Lanka; Sudan; Tanzania; Thailand; Trinidad and Tobago; Tunisia; Venezuela, Bolivarian Republic of; Vietnam; Zimbabwe
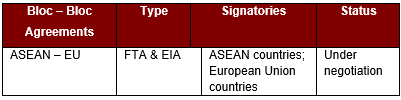
FTA – Free Trade Agreements
EIA – Economic Integration Agreement
PSA – Partial Scope Agreement
To learn more about Thailand’s trade agreements, follow the link below: