- Home
- /
- Invest in Indonesia
- /
- Indonesia-Economy
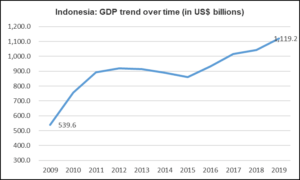
- GDP – Indonesia contributes 35% of ASEAN’s total GDP. Having grown by 107% since 2009, Indonesia has been one of the primary growth generators for South East Asia. The chart below depicts this journey of growth showcasing the impressive feat of more than doubling the size of the nation’s economy.
- Current GDP = USD 1.042 Trillion
GDP Per Capita – USD 4,135.6
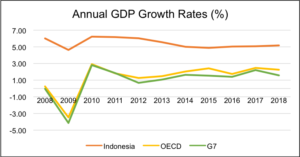
GDP Growth (%) – Indonesia’s GDP grew by 7% in the most recent year of analysis, i.e., 2019. It has also displayed healthy growth over the last five years with an average annual growth rate of 6.31%. As depicted in the chart below, The Year-on-Year growth of Indonesia over the past decade has outmatched that of many developed countries, remaining well above the average annual growth rates of the G7 and OECD. Another interesting point depicted by this graph is that Indonesia successfully insulated its economy during the global financial crisis, actually displaying positive growth unlike the G7 and OECD:
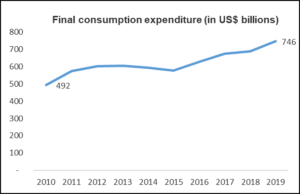
GDP Per Capita Growth (%) – Indonesia’s GDP Per Capita grew by 3.88% in the most recent year of analysis, i.e., 2019. An average annual growth rate of 3.8% over the last five years indicates stable growth in the country’s GDP Per Capita. The increase in average income could also explain the consistent rise in final consumption expenditure, which stood at US$ 746.25 Billion in 2019. Escalating levels of consumption make Indonesia an even more enticing prospect for foreign investors. As seen in the graph below, the nation’s final consumption expenditure has grown by a whopping 52% in a period of 10 years.
Sectoral contribution to GDP – Contribution to GDP can be broadly segmented into three sectors, namely, Agriculture, Industry, and Services.
Services
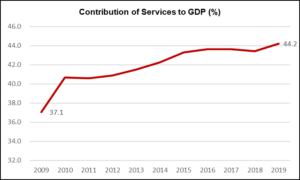
The services sector constituted 44.2% of Indonesia’s GDP in 2019. This represents a significant increase from a decade prior when the services sector added 37.1% of Indonesia’s national income. The increase in the value added by services and the decrease in value added by agriculture and industry took place simultaneously. This represents Indonesia’s increasing shift towards a services dependent economy.
Industry
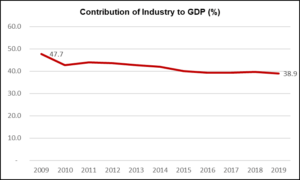
The industrial sector constituted 38.9% of Indonesia’s GDP in 2019, down from 47.7% a decade prior. The significant decrease in the industrial sector’s share of GDP could be explained by an increased dependence on the services sector.
Agriculture
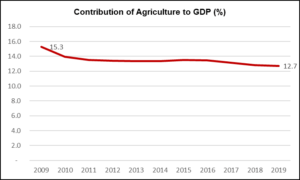
The agricultural sector constituted 12.7% of Indonesia’s GDP in 2019. As the graph below indicates, the percentage contribution of Agriculture to Indonesia’s GDP has consistently declined in the last decade. While the decline isn’t particularly substantial, it signifies the country’s increasing development and exhibits its reduced dependence on agrarian business.
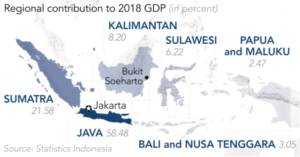
Geographic distribution of GDP – Knowledge of the regional contribution to Indonesia’s economic prowess is critical from an investment standpoint. The map below highlights the fact that most of Indonesia’s GDP currently comes from the islands of Java and Sumatra. It, however, also marks Bukit Soeharto the potential site for Indonesia’s new capital. A change in the capital city could impact the future regional distribution of national income, and therefore, guide investment decision making.
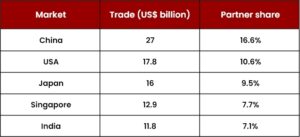
Primary Trade Partners – Trade partners of Indonesia can be categorized as importing partners and exporting partners.
The top 5 export markets for Indonesia in 2019 were as follows:
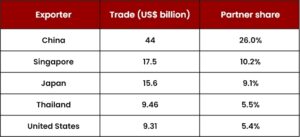
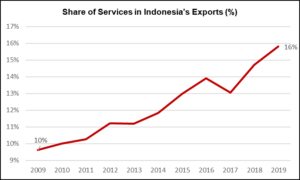
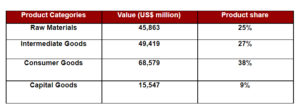
Goods, however, still constitute the lion’s share of Indonesia’s exports, comprising 84% of total exports in 2019. The table below illustrates the four categories of goods and their respective product shares.
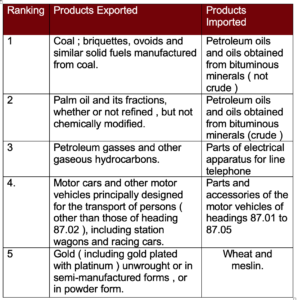
To learn about Indonesia’s international trade in further detail, click the link below:
https://wits.worldbank.org/countrysnapshot/en/IDN
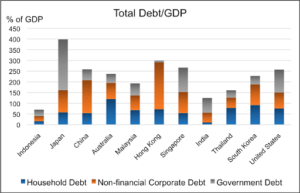
Debt to GDP Ratio – Indonesia boasts the lowest Total Debt to GDP ratio amongst its peers. The chart below depicts Indonesia’s Debt/GDP and where it stands relative to other Asian heavyweights and the United States.
Trade Agreements –
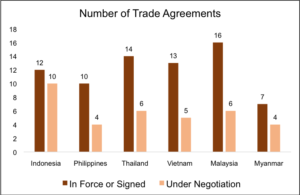
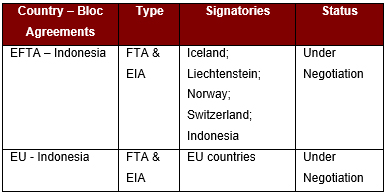
The Indonesian Government has become increasingly forward looking in terms of international trade, encouraged particularly by the prolonged trade war between the United States and China. The fact that they are currently engaged in 22 Trade Agreements that are either in force or under negotiation stands as proof of this. More than half of these trade agreements are already in force and negotiations are being ramped up to ratify the remaining ones. As the chart below indicates, Indonesia is making tremendous headway in establishing international trade relations. While it may have fewer ratified trade agreements than some of its peers, the number of agreements it is currently negotiating far exceeds those being negotiated by its counterparts, and this is a sign of Indonesia’s bright future.
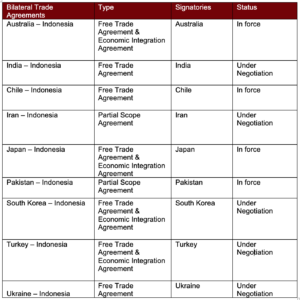
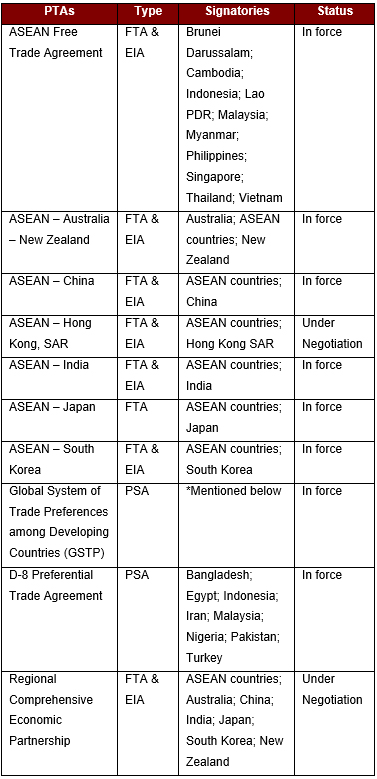
Indonesia’s Trade Agreements can be classified into the following four groups:
-
- Bilateral Trade Agreements
- Plurilateral Trade Agreements
- Country – Bloc Agreements
- Bloc – Bloc Agreements
*GSTP member countries – Algeria; Argentina; Bangladesh; Benin; Bolivia, Plurinational State of Bolivia; Brazil; Cameroon; Chile; Colombia; Cuba; Ecuador; Egypt; Ghana; Guinea; Guyana; India; Indonesia; Iran; Iraq; Korea, Democratic People’s Republic of; Korea, Republic of; Libya; Malaysia; Mexico; Morocco; Mozambique; Myanmar; Nicaragua; Nigeria; Pakistan; Peru; Philippines; Singapore; Sri Lanka; Sudan; Tanzania; Thailand; Trinidad and Tobago; Tunisia; Venezuela, Bolivarian Republic of; Vietnam; Zimbabwe
FTA – Free Trade Agreements
EIA – Economic Integration Agreement
PSA – Partial Scope Agreement
To learn more about Indonesia’s trade agreements, follow the link below:

