- Home
- /
- Laos-landing-2020
- /
- Laos-Economy
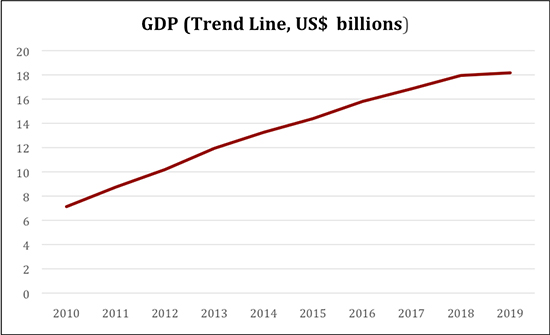
GDP– As per the World Bank, the GDP of Laos stood at US$ 18.17 billion in the year 2019. The GDP of the country has seen a steady growth. Beginning at US$ 7.12 billion in the year 2010, the economy has seen an increase of 155% over the course of the last 10 years.
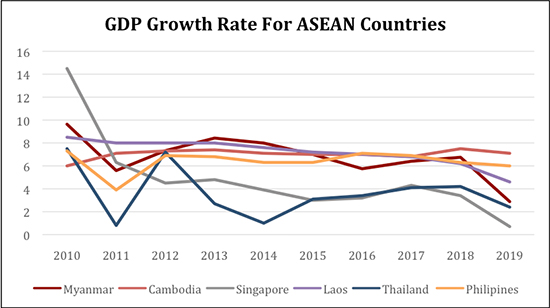
GDP Growth (%)- The chart below depicts a comparative of the GDP growth for 6 different ASEAN countries. From the chart it can be inferred that Laos’s GDP growth along with Cambodia has been way more stable compared to its regional peers.
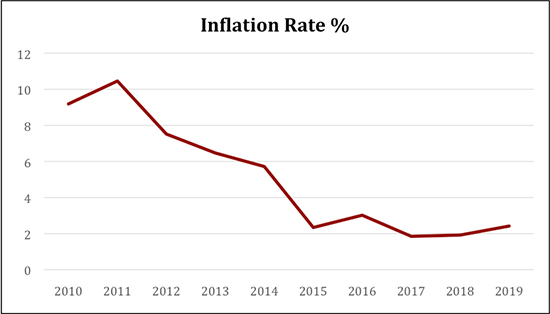
Inflation Rate-The following chart depicts the inflation rate of Laos between the years 2010 and 2019. The chart is an indication of the efforts taken by the government to bring down the inflation rate from 9.19% in 2010 to 2.4% in 2019.
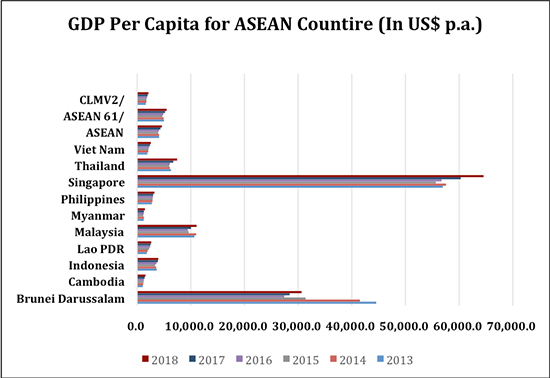
GDP Per Capita – The chart below provides for a comparison between the GDP per capita for all the ASEAN countries. The chart shows that Laos lags behind its regional peers significantly and has to improve a lot, in order to improve the standard living of the people. In 2018, the GDP per capita was only more than that of Vietnam, Myanmar and Cambodia.
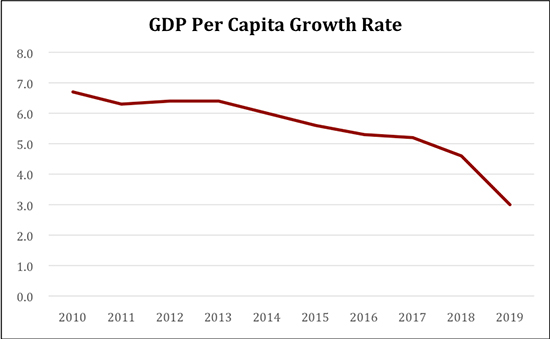
GDP Per Capita Growth Rate–As per the World Bank, the growth in the GDP Per Capita stood at 3% in the year 2019. The following chart depicts the data relevant for the years between 2010 & 2019. Consistently there has been a negative growth in the GDP Per Capita of Laos.
Sectoral contribution to GDP – The sectoral contribution to GDP pf Laos can be based on the division of the 3 sectors:
- Services
- Industry
- Agriculture
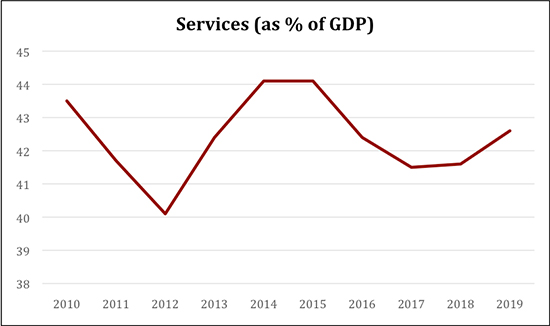
Services
Services has consistently been the highest contributor to the GDP of Laos. The contribution of the sector has decreased in the course of the last 10 years. Beginning in 2010 the sector contributed about 43.5% to the GDP but it came down to 42.6% in the year 2019, showing negative growth of 2%. Although this contribution hasn’t been very steady over the years, decreasing drastically in the 2012 and increasing in the 2014.
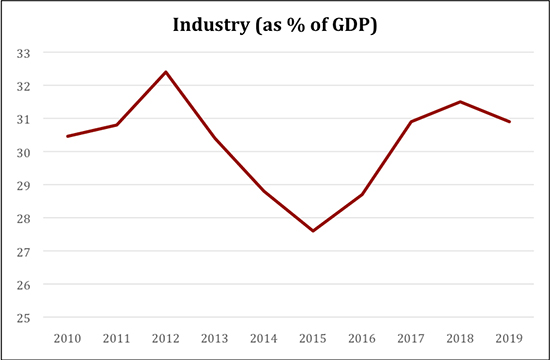
Industry
Industry has been the second highest contributor to the GDP of Laos, after Services. The journey just like that of services hasn’t been consistent or stable, observing a rampant fall in the year 2015. Beginning in 2010, at30.46% in 2019 it ended at 30.9%, showing a positive growth of 1.6%.
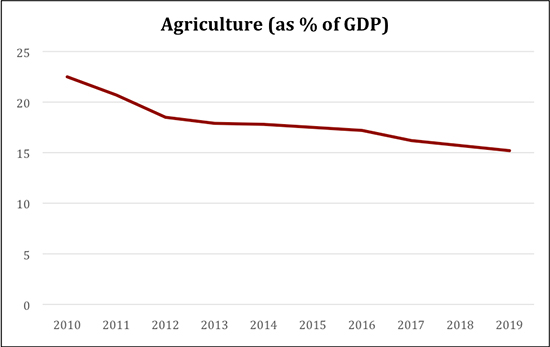
Agriculture
Despite the maximum employment generated by the sector, the output of the sector is the least in terms of its contribution to the sector. The sector has shown consistent negative growth of 32% over the course of 10 years beginning at 22.5% in 2010, ending with 15.2% in the year 2019.
Employment by Sector- As per the World Bank data (based on ILO estimates), the following chart depicts the employment by sector in Laos in 2019.
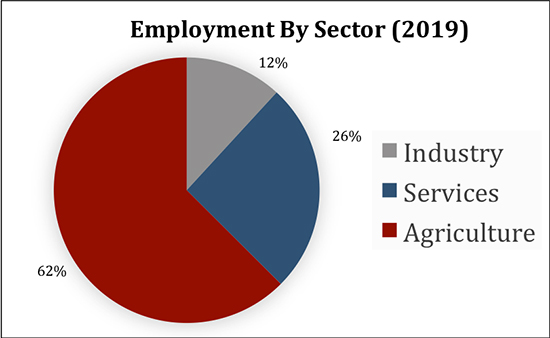
From the above chart we can observe that it is very clear that the agricultural sector accounts for the maximum employment in Laos. It also establishes that Laos is predominantly an agrarian economy. The agricultural sector accounts for 62% of the entire employment in Laos, which followed by the services economy at 26%, which is eventually followed by the industrial sector at 12%. This also shows that the country has a lot of potential to re-allocate its resources in order to become a developed country. Also despite, majority of the employment being generated by the Agricultural sector but the contribution to the GDP is the least.
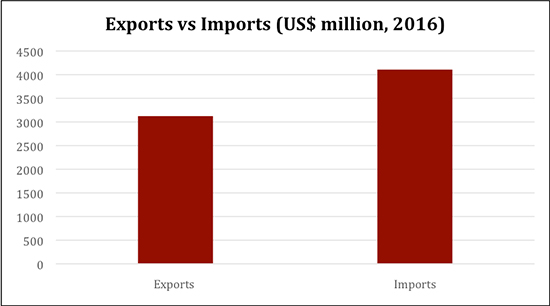
Imports and Exports- According to the World Trade Organisation, in 2016 the imports of Laos amounted to USD 4107 million, whereas the exports amounted to USD 3124 million. This gives Brunei a negative balance of payments amounting to USD 983 million. A few important figures regarding imports/exports are as follows-
– Lao PDR, Service exports (BoP, current US$) is 921,428,964.15.
– Lao PDR, Service imports (BoP, current US$) is 1,154,151,124.60.
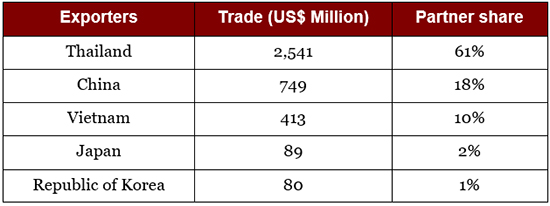
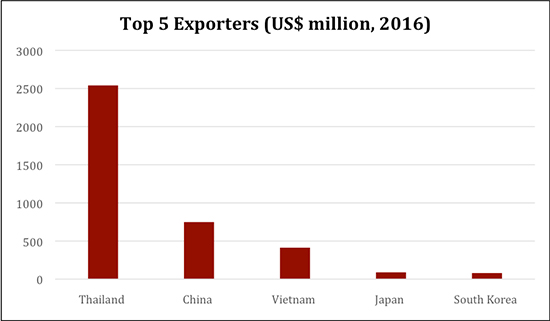
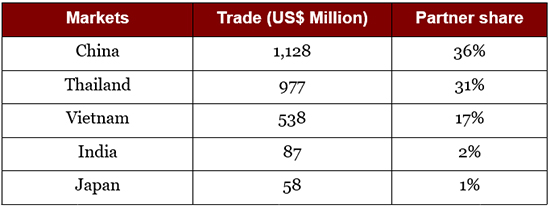
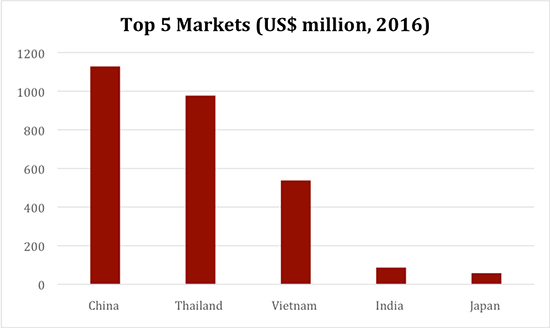
Primary Trade Partners – Trade partners of Laos are categorised as importing markets and exporting partners.
The top 5 export markets for Laos in 2016 were as follows:
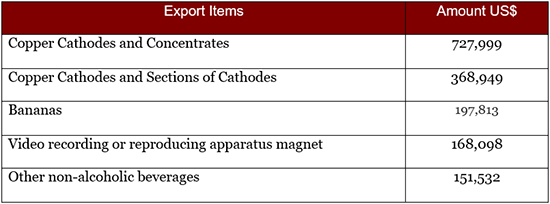
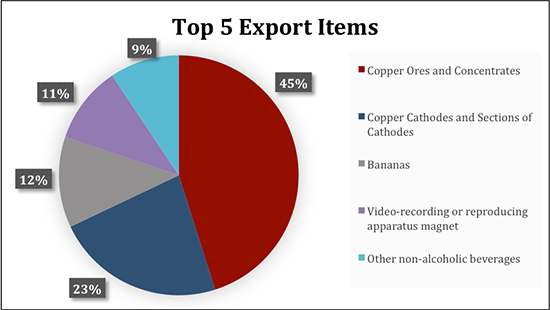
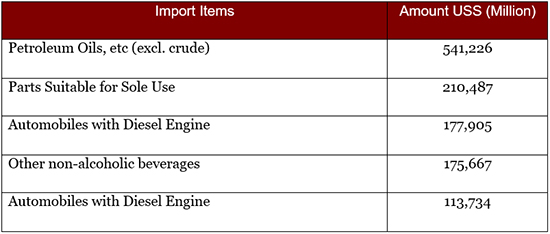
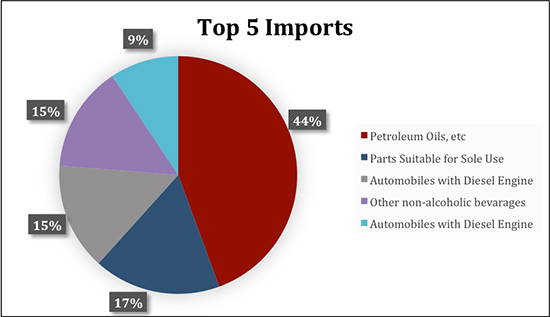
Product contribution to exports and imports – The charts below depict the top 5 export and import items of Laos.
Product contribution to exports and imports – The charts below depict the top 5 export and import items of Laos.
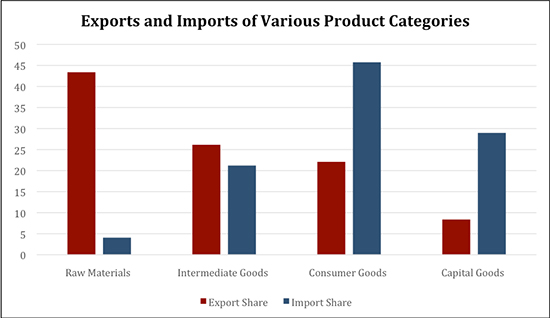
Exports/Imports of Various Product Categories- The following chart depicts the quantities exported and imported in the various product categories namely- Capital Goods, Consumer Goods, Intermediate Goods and Raw Materials in the year 2018.
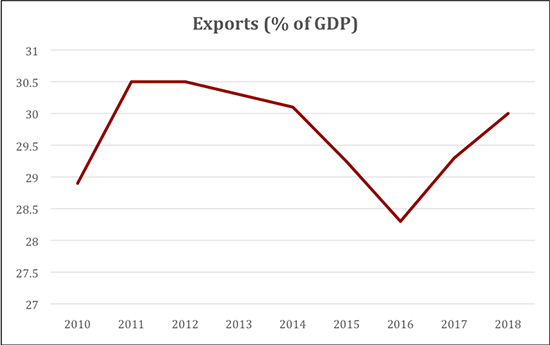
Exports to GDP Ratio – The following chart depicts the exports to GDP ratio of Laos between 2010-2018. As of 2018 the Exports to GDP lies at roughly 30% having increased from 28.9% in the year 2010.
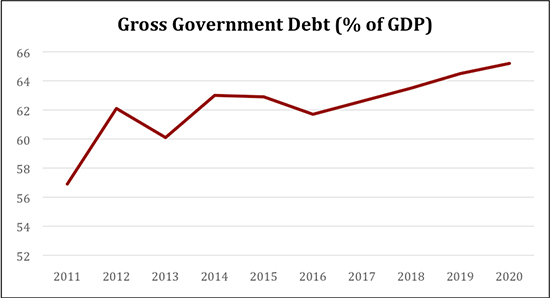
Debt to GDP Ratio – The chart below depicts the Gross government debt of Laos as a percentage of GDP, as per the IMF. In the entirety of the 10 years the Debt to GDP ratio has increased consistently. It began at 56.9% in the 2011 and increased by 12.7% over the years to reach 65.2% in the year 2020.
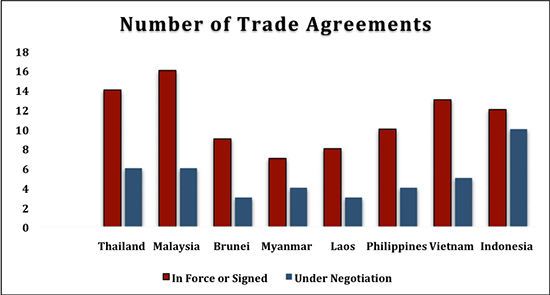
Trade Agreements –Laos is part of the ASEAN Free Trade Agreement (AFTA) and several other plurilateral/bilateral Free Trade Agreements (FTAs). As a result of these agreements businesses in Laos can carry out tariff-free trade with multiple nations. A comparative view of 8 major ASEAN economies, as seen in the graph below, reveals that Laos has a lot of catching up to do, relative to its other ASEAN peers. The chart depicts that Laos is the country with the least number of trade agreements (both enforced and under-negotiation) along with Myanmar.
Laos’s Trade Agreements can be classified into the following two groups:
– Multilateral Trade Agreements (MTAs)
– Bloc – Bloc Agreements
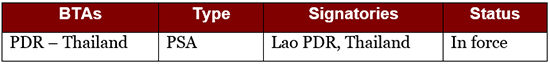
– Bilateral Agreements (BTAs)
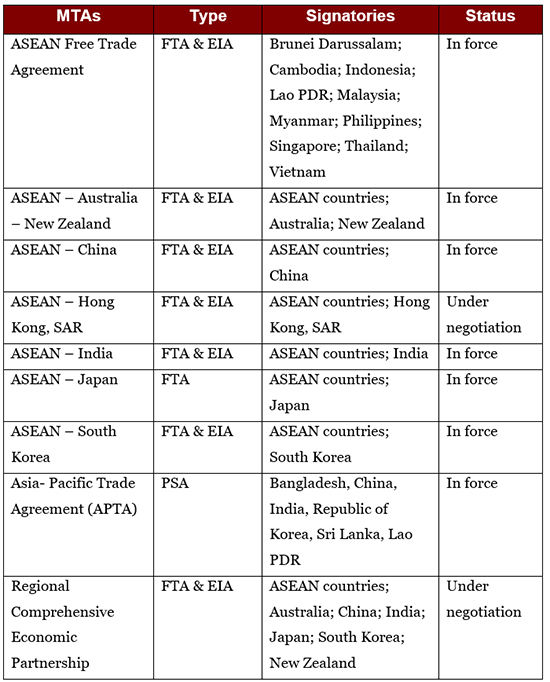
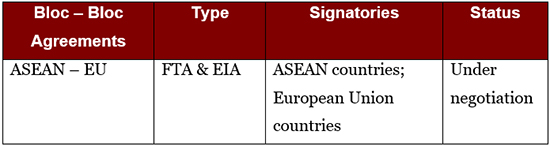
FTA – Free Trade Agreements
EIA – Economic Integration Agreement
PSA – Partial Scope Agreement
To learn more about Laos’s trade agreements, follow the link below: