- Home
- /
- Philippines-landing-2020
- /
- Philippines-Economy
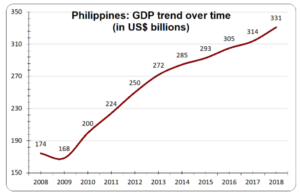
GDP –Constituting 11% of ASEAN’s total GDP, Philippines’s economy grew to almost US$ 331 billion in the year 2018. While this may be significantly smaller than the economies of South East Asian behemoths like Indonesia and Thailand, what is particularly encouraging is the rate at which Philippines’ economy has exhibited growth. As shown in the graph below, the country’s GDP has grown by over 90% since 2008, thus making it comparable to the likes of Malaysia and Singapore. If this upward trend persists, Philippines could prove itself to be an economic force in ASEAN.
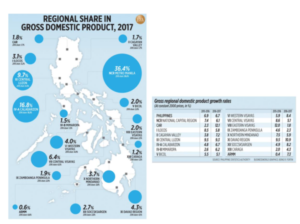
Geographic distribution of GDP – Given the Philippines’ vast geographic expanse, it is important to consider the regional distribution of the country’s GDP. As can be seen from the image below, Philippines’ National Capital Region unsurprisingly contributed the largest share to the country’s economy, with the region of Calabarzon coming in at second place.
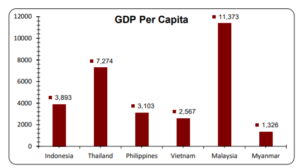
GDP per capita –As of 2021, Philippines’ GDP per capita is projected at $8791. As indicated in the graph below, the prevailing average income in the Philippines is significantly below the levels enjoyed in some other emerging markets of ASEAN, leaving sufficient room for improvement in this regard. If Philippines is to compete with other South East Asian countries for the region’s top economic spot, addressing the nation’s low average income must be given top priority.
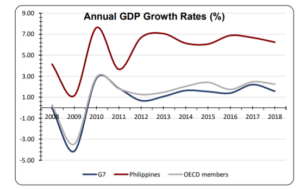
GDP Growth (%)–The Philippines has established a commendable track record of annual GDP growth. In 2021 the nation recorded a growth rate of 6.60% and, in doing so, overshadowed the average performance by OECD countries and G7 members. As shown the chart below, the Philippines has consistently outperformed the OECD and the G7 since 2008 and has, thus, cemented its status as an emerging market to look out for.
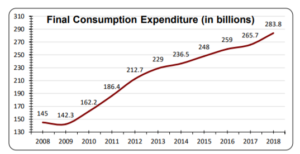
GDP per capita growth (%)– With a healthy growth of 5.15% in GDP per capita for the year 2018, the Philippines continued on its journey of economic progress. In the last five years, the Philippines has not witnessed its GDP per capita growth fall below 4% and its consistent performance in this metric could be responsible for the country’s rising consumption expenditure which has nearly doubled since 2008.
Sectoral contribution to GDP – Contribution to GDP can be broadly segmented into three sectors, namely, Agriculture, Industry, and Services.
Services
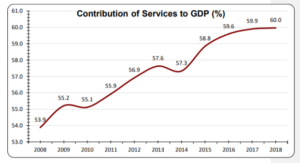
The services sector has historically constituted a large share of the Philippines’ GDP, and its importance to the economy only seems to be growing. As indicated in the chart below, Services made up 60.40% of the country’s economy in 2021, up from 55.9% a decade prior. Given that this growth has followed an unwavering path, services could continue to occupy the lion’s share of Philippines’ GDP.
Industry
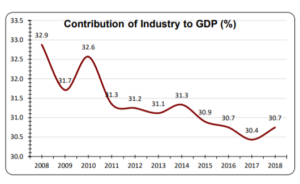
Though industry has traditionally been a substantial contributor to Philippines’ GDP, it has seen its share of the economy slowly decrease over time. As exhibited in the chart below, Industry constitutes nearly 29.80% of Philippines’ GDP in 2021. This gradual reduction in the GDP share of industry could be explained by an increasing emphasis on the services sector.
Agriculture
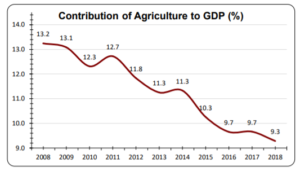
Agriculture is not a major contributor to the Filipino GDP, and it hasn’t been for a very long time. As can be seen from the chart below, the agricultural sector contributed only 9.8% of the Filipino economy in 2021, representing a decline in its GDP share from a decade prior. If the services sector continues to gain importance in the national economy, agriculture might continue to see a decline in its share of GDP.
Primary Trade Partners – Trade partners of Philippines are categorised as importing partners and exporting partners.
To learn more about sectoral contribution to Philippines’ GDP, follow the link below:
https://databank.worldbank.org/source/world-development-indicators
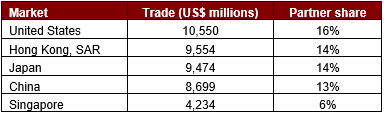
The top 5 export markets for Philippines in 2018 were as follows:
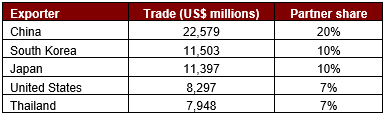
The top 5 exporting countries to Philippines in 2018 were as follows:
Product contribution to exports and imports –Philippines’ exports can be broadly segregated into two categories, namely, goods and services. While goods certainly make up the majority of the country’s exports, services, too, play a substantial role. As can be seen from the graph below, the export share of services has been on a gradual incline over the last few years, thus, reiterating the increased importance of the services sector to the Filipino economy.
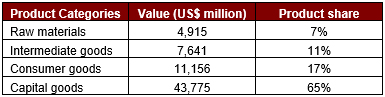
Despite the rising share of services in exports, goods still command the majority share, constituting over 57% of exports in 2018. The table below illustrates the four categories of goods and their respective product shares.
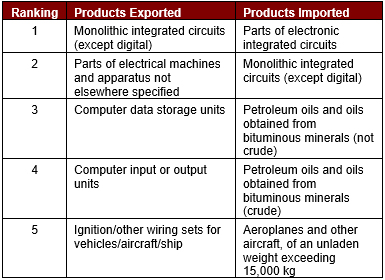
The top 5 products exported and imported by Philippines are as follows:
To read more about Philippines’ international trade, follow the link below:
https://wits.worldbank.org/countrysnapshot/en/PHL
Exports to GDP ratio – 31.7%
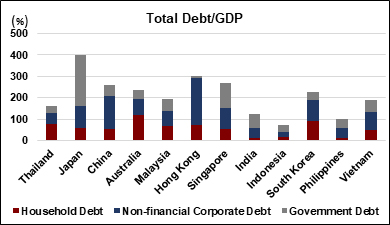
Debt to GDP Ratio – Philippines has among the lowest Debt/GDP levels of its peers and, as exhibited in the chart below, it has a particularly low instance of household debt. This bodes well for the country as it looks to compete with other regional emerging markets for the attention of foreign investors.
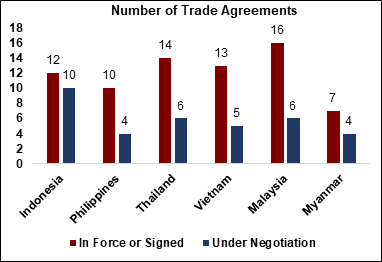
Trade Agreements– Of the major ASEAN emerging markets, Philippines has the lowest number of trade agreements, both those already in force and those being negotiated. In an increasingly globalised world, the value of trade cannot be overstated. As such, the Philippines must endeavour to be more liberal in its trade policy in order to compete with regional heavyweights like Indonesia. A comparative overview of 6 ASEAN economies, as seen in the graph below, reveals Philippines’ current standing in foreign trade.
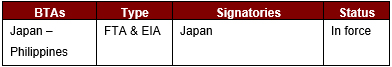
Philippines’ Trade Agreements can be classified into the following four groups:
– Bilateral Trade Agreements (BTAs)
– Multilateral Trade Agreements (MTAs)
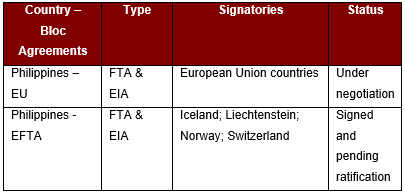
– Country – Bloc Agreements
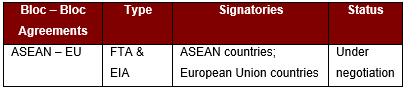
– Bloc – Bloc Agreements
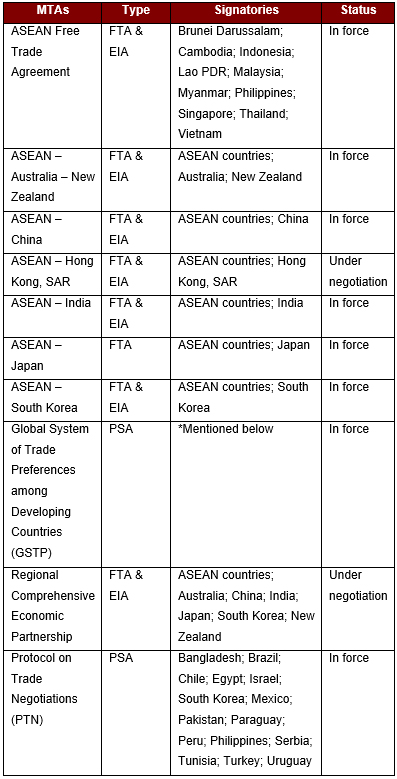
*GSTP member countries – Algeria; Argentina; Bangladesh; Benin; Bolivia, Plurinational State of Bolivia; Brazil; Cameroon; Chile; Colombia; Cuba; Ecuador; Egypt; Ghana; Guinea; Guyana; India; Indonesia; Iran; Iraq; Korea, Democratic People’s Republic of; Korea, Republic of; Libya; Malaysia; Mexico; Morocco; Mozambique; Myanmar; Nicaragua; Nigeria; Pakistan; Peru; Philippines; Singapore; Sri Lanka; Sudan; Tanzania; Thailand; Trinidad and Tobago; Tunisia; Venezuela, Bolivarian Republic of; Vietnam; Zimbabwe
FTA – Free Trade Agreements
EIA – Economic Integration Agreement
PSA – Partial Scope Agreement
To read about Philippines’ trade agreements in greater detail, follow the link below: